![]()
|
|
| INDEX
| Evolution | Sales
| by
country | back
| next |
|
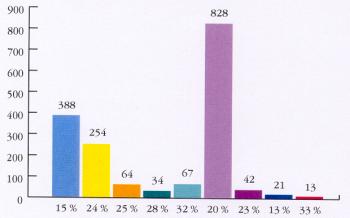
Evolution
(by volume) |
|||||||||||||||||||||||||||||||||||||||||||||||
|
A sector that is increasingly geared to foreign markets : exports are up by 2 points between 1997 and 1998 and by 12 points in eight years. |
||||||||||||||||||||||||||||||||||||||||||||||
- top -
|
European
Exports |
Whilst most trade remains concentrated whitin the European countries, sales outside the European Union represent 20 % of the total exports in 1998, showing a decrease due to the crisis in Asia | ||||||||||||||||||||||
|
- top -
|
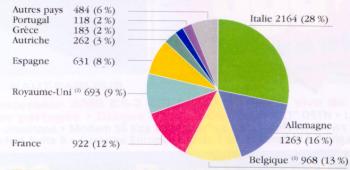
European
exports
|
Italy maintains its leading position in European yarn exports by value, follwed by Germany, Belgium and France. |
||||
| (1)
the whole of Benelux for continuous-filament yarns (2) including Ireland for Linen. |
|||||
The European spinning Industry - Economic Dossier - -A study produced by the Institut Français de la Mode on behalf of EXPOFIL
© TEXMONDO - 2000 - Published with the kind agreement of Expofil